
目次
はじめに
こんにちは、ハヤシです。
AWSを使っていると、「気づかぬうちに高額なサービスを使い続けて予期せぬ出費が発生した...」なんて経験があると思います。
リスク管理はすべきと思いつつ、定期的にコンソールを開いて確認するのはかなり手間です。
ということで、そんなめんどくさがり屋さんでも毎日のAWSの利用料を気軽にチェックできる仕組みを作成してみました。
やってみた
では、早速実践に移ります。
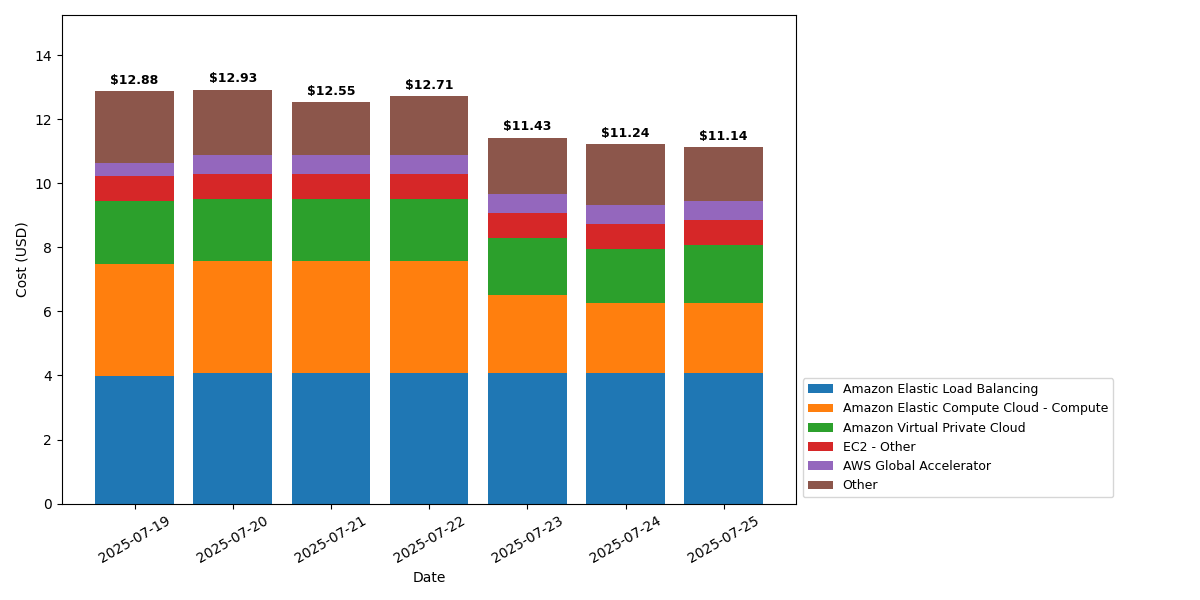
今回は、Cost Explorerから取ってきた直近7日分の利用料をグラフ化した画像をS3に保存し
それをSlackに通知させる仕組みを作成します。
Slack Appの作成
まずは、作成したグラフの画像(のURL)を送ってくれるSlack Appを作成します。
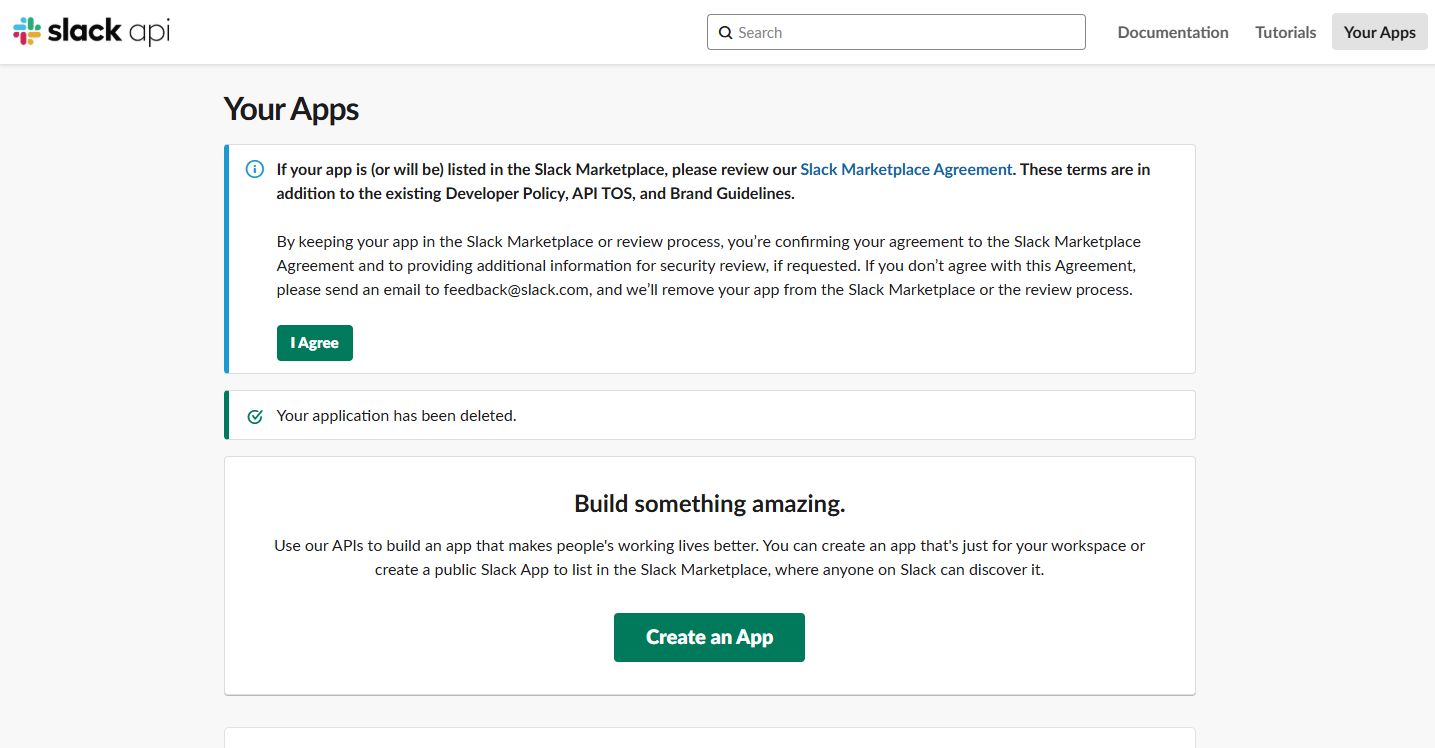
以下URLから適宜対象のワークスペースにてSlack Appを作成してください。
https://api.slack.com/apps
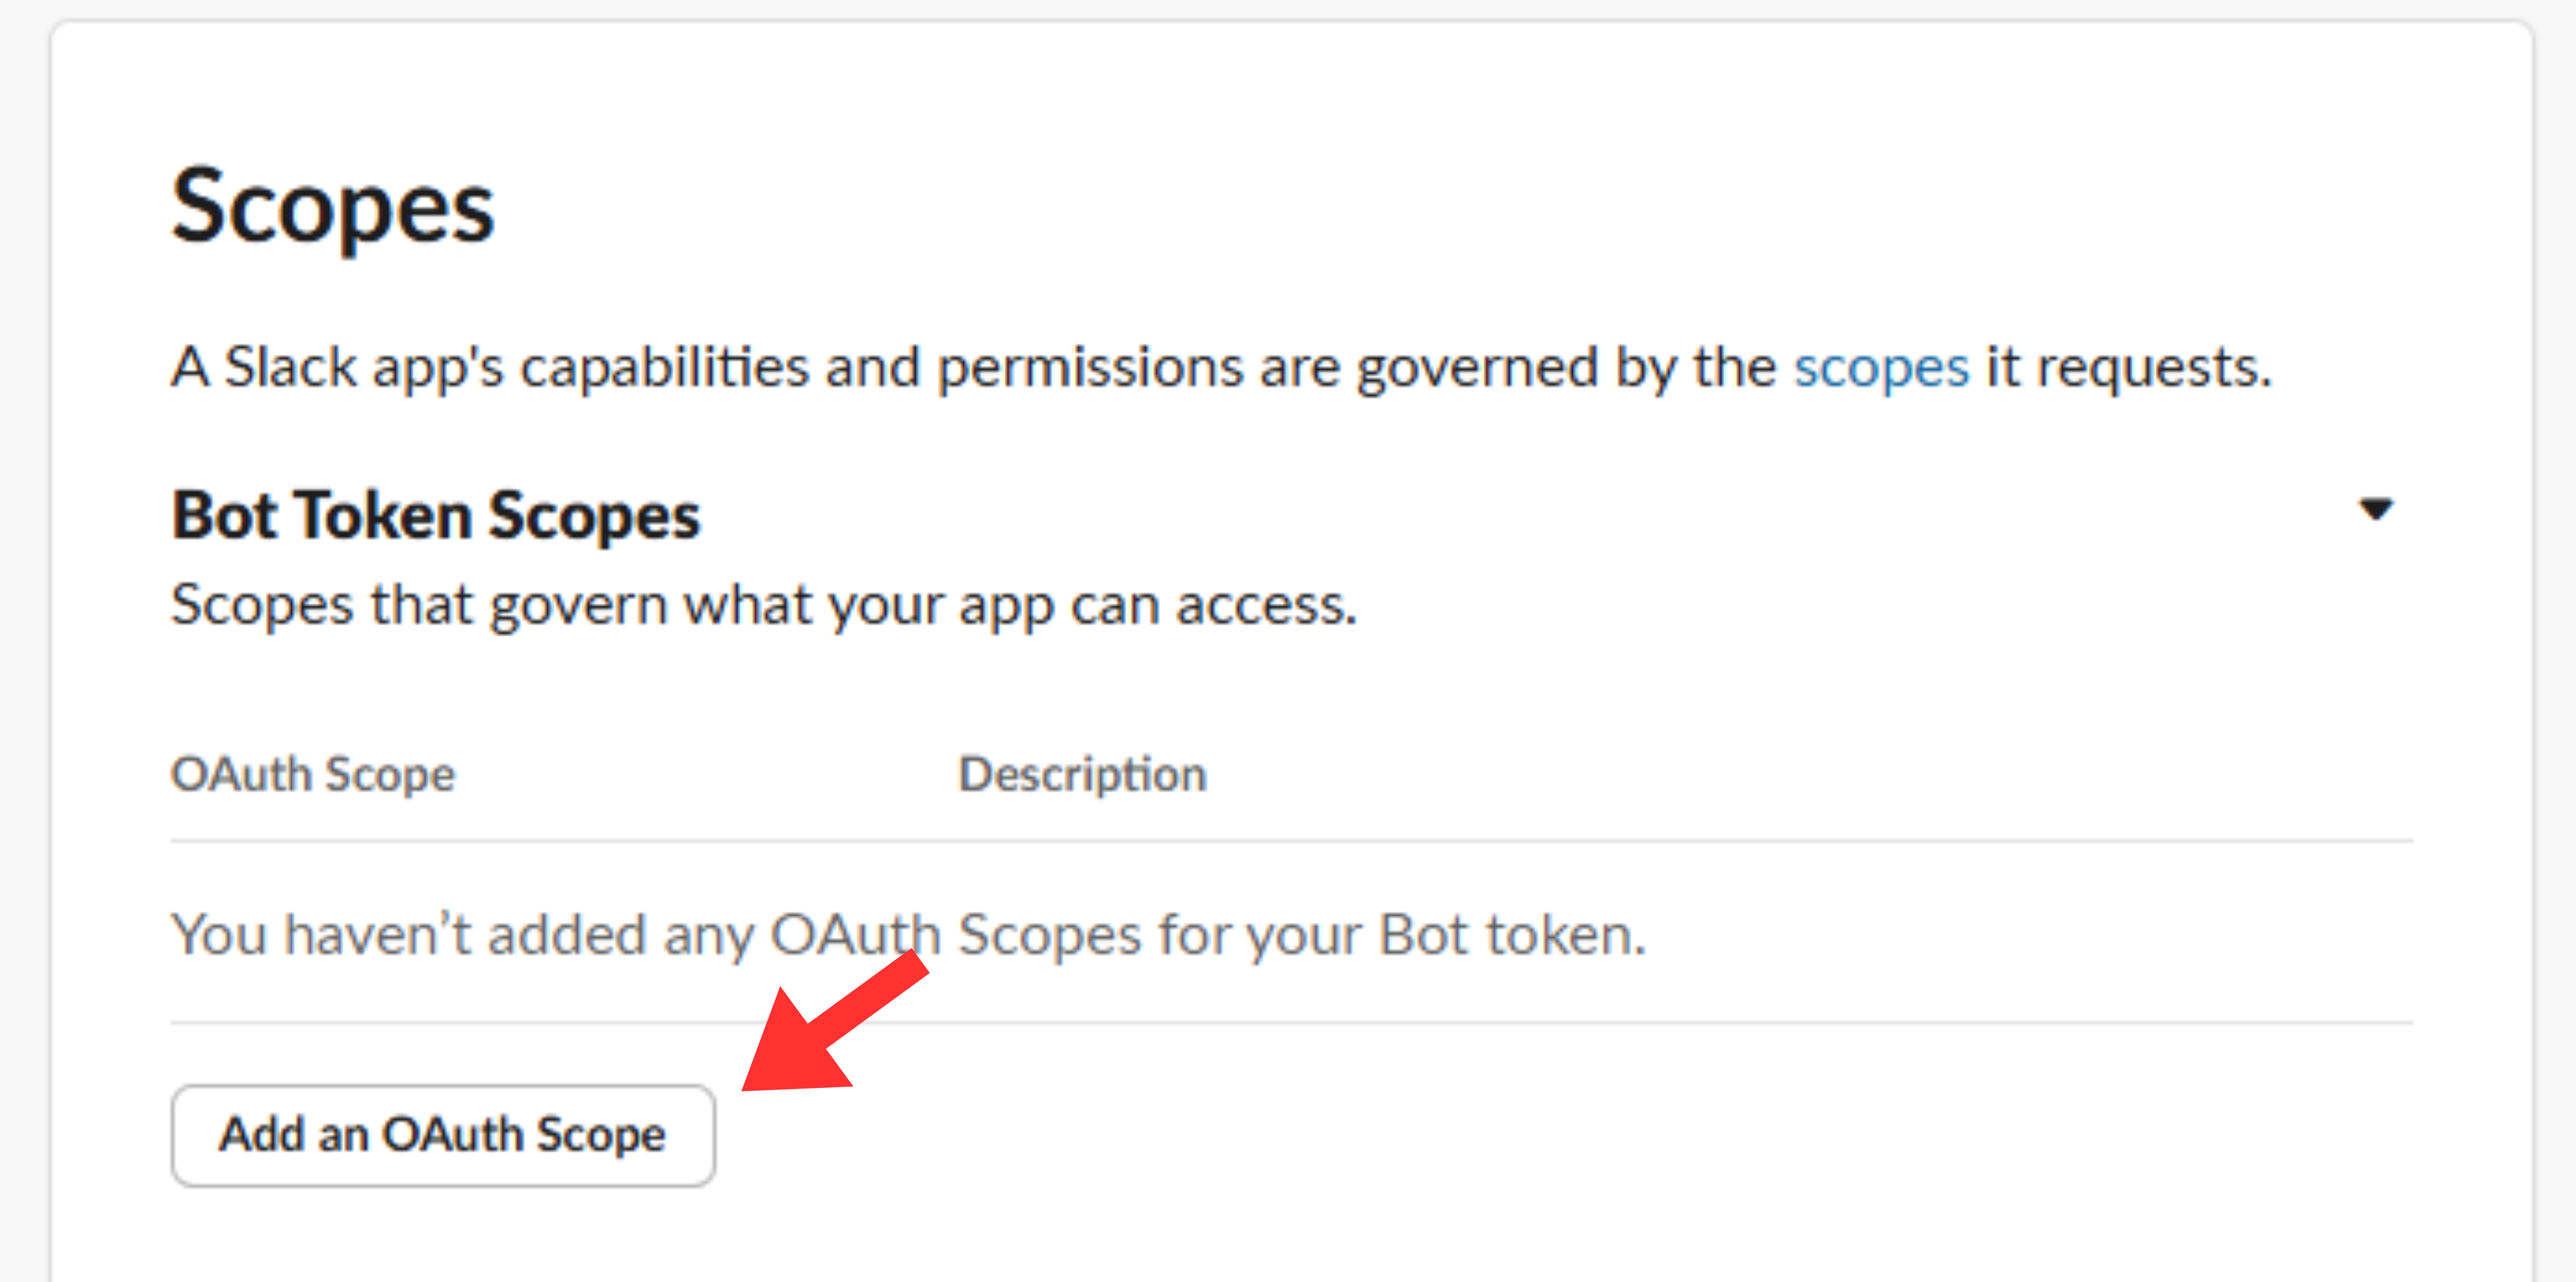
作成できたら OAuth&Permissions > Scopes へ移動し
「Bot Token Scopes」に「chat:write」「files:write」の権限を付与します。
権限の設定が出来たら、「Install App」のへ移動し、Slack Appをインストールします。
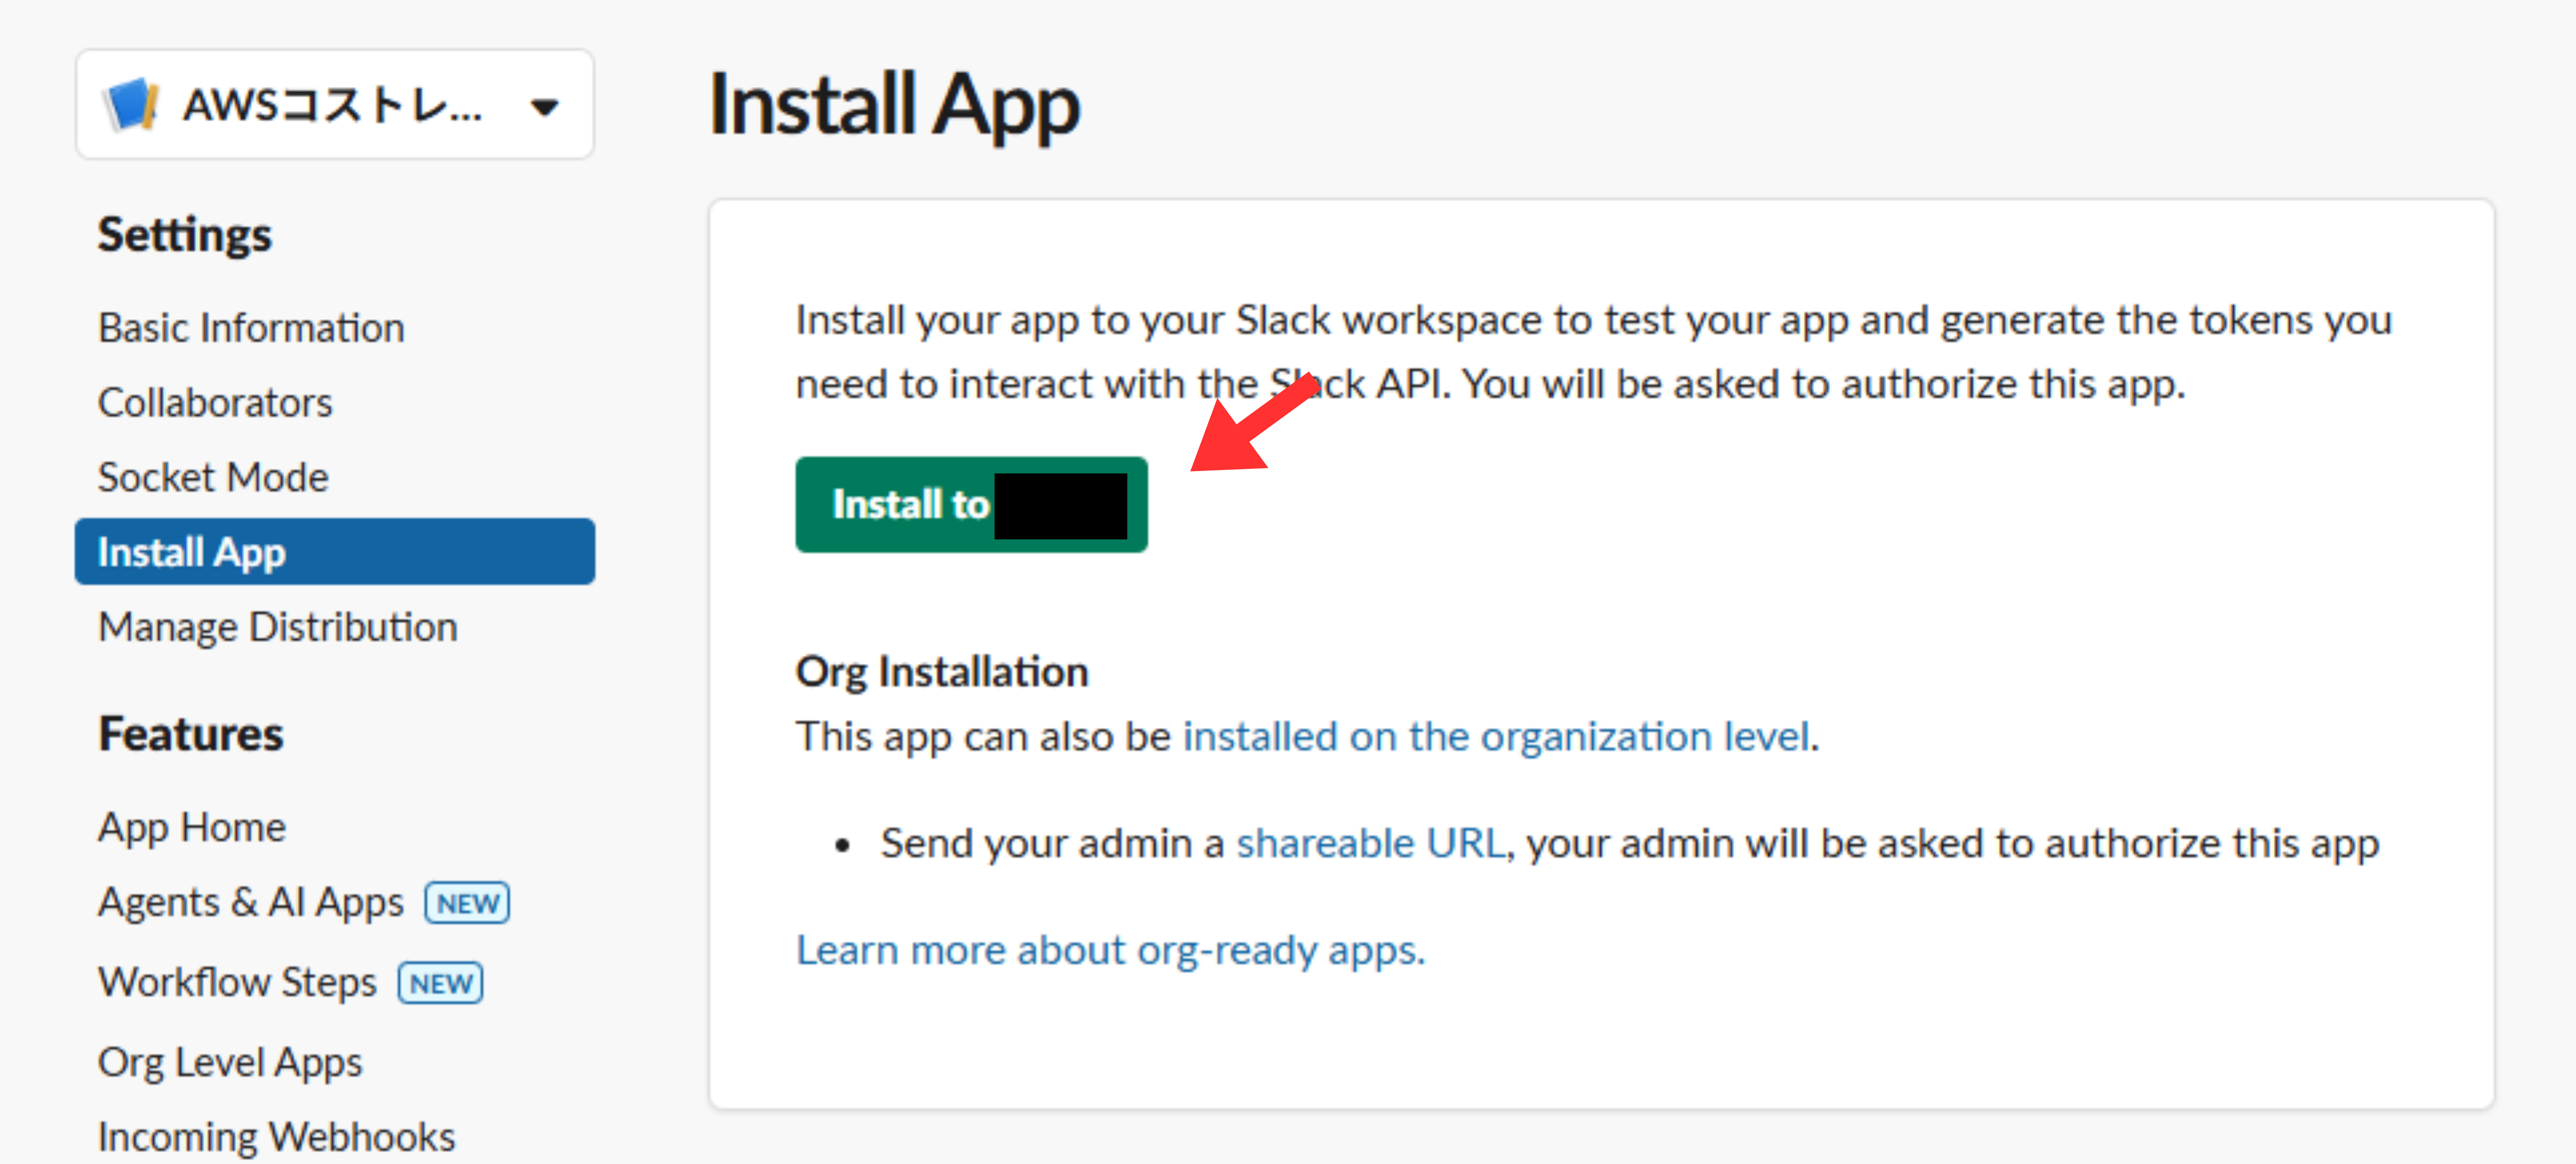
そうすると、Slack Appのトークンが取得できます。
これは後ほど使用するのでメモに取っておいてください。
また、作成したSlack Appは対象のSlackのチャンネルに追加しておいてください。
S3の作成
次に、任意の名前でS3を作成します。
このS3にグラフ化した画像を保存していきます。
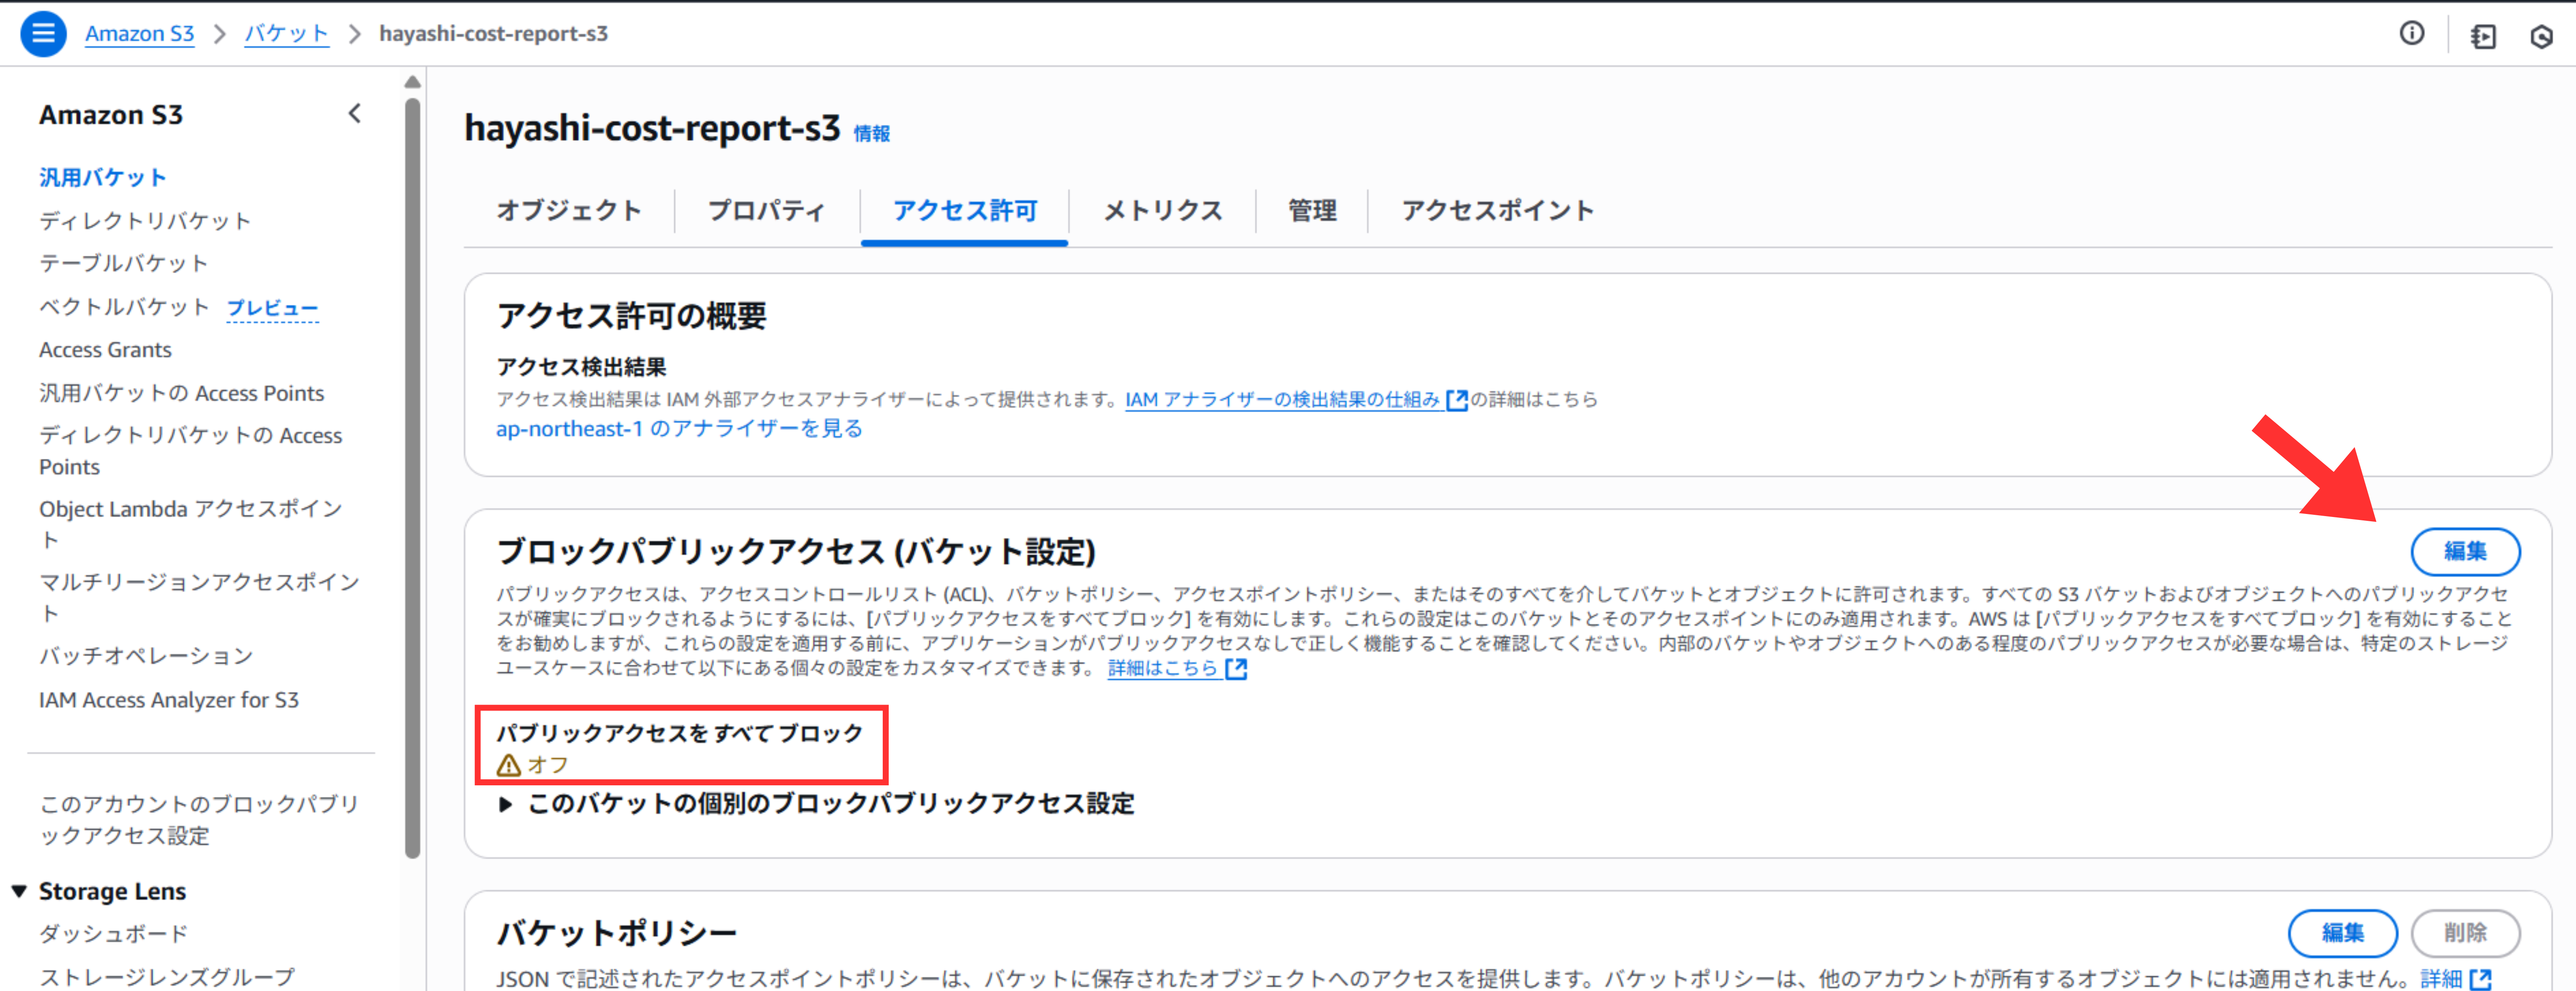
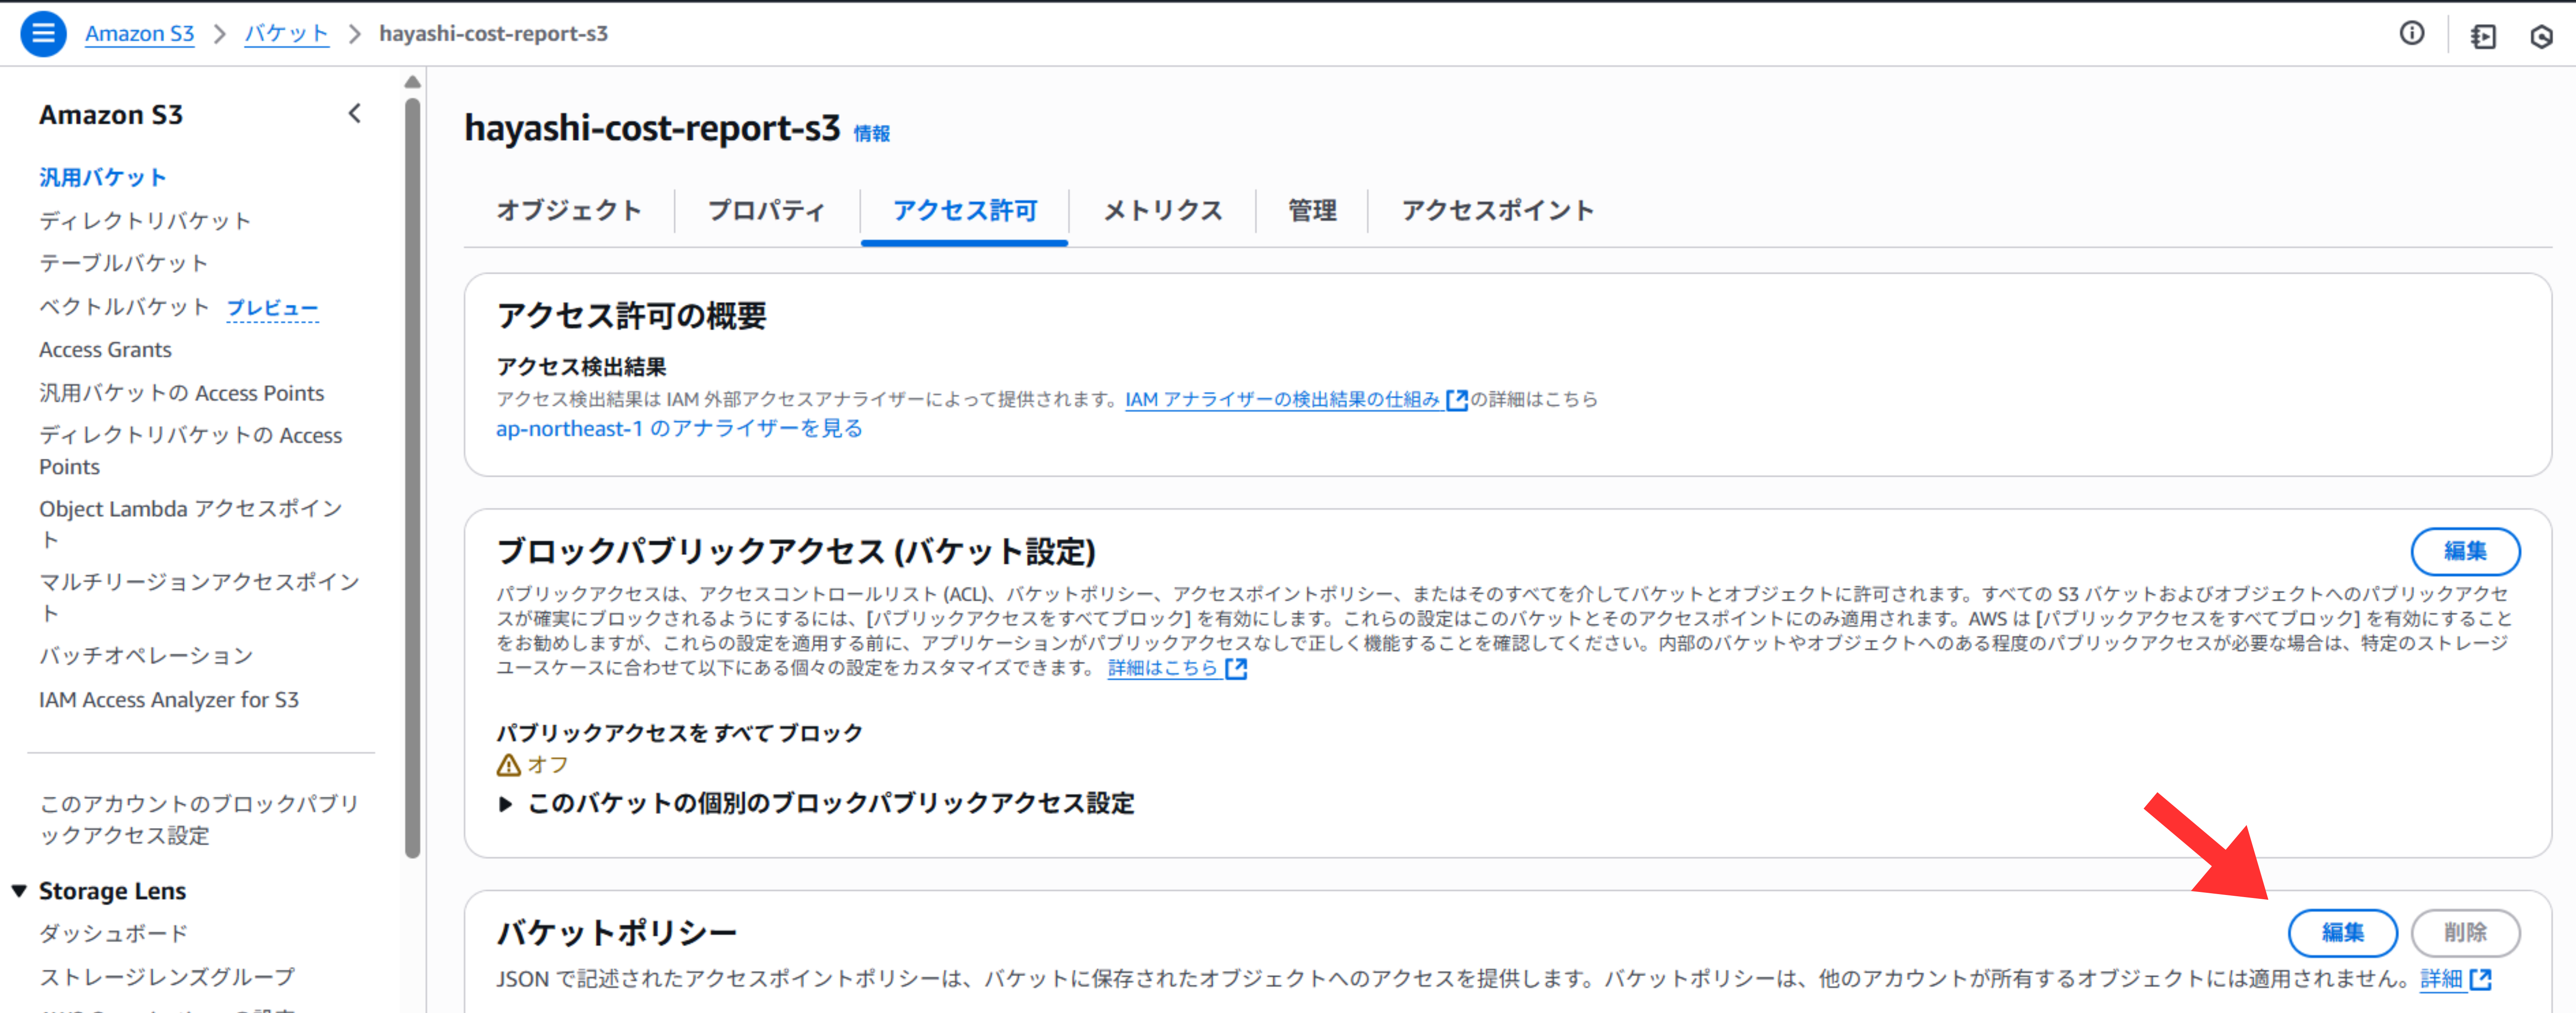
まずは、いつでも画像を見返せるようにファイルを公開させます。
「アクセス許可」タブから「ブロックパブリックアクセス機能」をオフにしてください。
そしてバケットポリシーに以下ポリシーを追加します。
{
    "Version": "2012-10-17",
    "Statement": [
        {
            "Sid": "Statement1",
            "Effect": "Allow",
            "Principal": "*",
            "Action": "s3:GetObject",
            "Resource": "arn:aws:s3:::バケット名/*"
        }
    ]
}
これでファイルは公開されました。
もし非公開にしたい場合は署名付きURLを使用することも可能です。
この場合、オブジェクトの閲覧には有効期限が設定されるので注意してください。
Lambdaの作成
続いて任意の名前でLambda作成をします。ランタイムはpython3.10を指定しました。
ポリシーには以下を付与します。
{
    "Version": "2012-10-17",
    "Statement": [
        {
            "Sid": "VisualEditor0",
            "Effect": "Allow",
            "Action": "ce:GetCostAndUsage",
            "Resource": "*"
        },
        {
            "Effect": "Allow",
            "Action": [
                "s3:PutObject",
                "s3:GetObject"
            ],
            "Resource": "*"
        }
    ]
}
ソースコードは以下です。
AWSコストデータ取得 → グラフ画像を生成 → S3にアップロード → Slackに通知
という流れを実施しています。
import os
import boto3
from datetime import datetime, timedelta
import matplotlib
matplotlib.use('Agg')
import matplotlib.pyplot as plt
import numpy as np
from slack_sdk import WebClient

SLACK_TOKEN = os.environ['SLACK_BOT_TOKEN']
CHANNEL_ID = os.environ['SLACK_CHANNEL_ID']
S3_BUCKET = os.environ['S3_BUCKET']
TOP_N = 5

def get_cost_data(days=7):
    ce_client = boto3.client('ce')
    end = datetime.utcnow().date()
    start = end - timedelta(days=days)
    response = ce_client.get_cost_and_usage(
        TimePeriod={'Start': start.isoformat(), 'End': end.isoformat()},
        Granularity='DAILY',
        Metrics=['BlendedCost'],
        GroupBy=[{'Type': 'DIMENSION', 'Key': 'SERVICE'}]
    )
    return response

def get_monthly_total():
    ce_client = boto3.client('ce')
    today = datetime.utcnow().date()
    month_start = today.replace(day=1)
    response = ce_client.get_cost_and_usage(
        TimePeriod={'Start': month_start.isoformat(), 'End': today.isoformat()},
        Granularity='MONTHLY',
        Metrics=['BlendedCost']
    )
    amount = response['ResultsByTime'][0]['Total']['BlendedCost']['Amount']
    try:
        total = float(amount)
    except Exception:
        total = 0.0
    return total

def parse_cost_data(response):
    dates = [r['TimePeriod']['Start'] for r in response['ResultsByTime']]
    service_costs = {}
    for i, result in enumerate(response['ResultsByTime']):
        for group in result['Groups']:
            service = group['Keys'][0]
            cost = float(group['Metrics']['BlendedCost']['Amount'])
            service_costs.setdefault(service, [0.0]*len(dates))
            service_costs[service][i] = cost
    return dates, service_costs

def sort_dates_and_costs(dates, service_costs):
    date_with_idx = sorted([(d, i) for i, d in enumerate(dates)])
    sorted_dates = [d for d, _ in date_with_idx]
    sorted_indices = [i for _, i in date_with_idx]
    sorted_service_costs = {}
    for svc, costs in service_costs.items():
        sorted_service_costs[svc] = [costs[i] for i in sorted_indices]
    return sorted_dates, sorted_service_costs

def create_stacked_bar_chart(dates, service_costs, top_n, out_path):
    service_totals = {svc: sum(costs) for svc, costs in service_costs.items() if sum(costs) > 0}
    sorted_services = sorted(service_totals.items(), key=lambda x: x[1], reverse=True)
    top_services = [svc for svc, _ in sorted_services[:top_n]]
    other_services = [svc for svc in service_totals if svc not in top_services]
    stacked_costs = {svc: service_costs[svc] for svc in top_services}
    if other_services:
        stacked_costs['Other'] = [sum(service_costs[svc][i] for svc in other_services) for i in range(len(dates))]
    picked_services = list(stacked_costs.keys())
    day_totals = [sum(stacked_costs[svc][i] for svc in picked_services) for i in range(len(dates))]
    colors = plt.get_cmap("tab10").colors
    color_list = [colors[i % len(colors)] for i in range(len(picked_services))]
    plt.figure(figsize=(12,6))
    indices = np.arange(len(dates))
    bottom = np.zeros(len(dates))
    max_y = 0
    for i, svc in enumerate(picked_services):
        plt.bar(indices, stacked_costs[svc], bottom=bottom, label=svc, color=color_list[i])
        bottom += np.array(stacked_costs[svc])
        max_y = max(max_y, max(bottom))
    for idx, total in enumerate(day_totals):
        plt.text(idx, bottom[idx] + (max_y * 0.01), f"${total:.2f}", ha="center", va="bottom", fontsize=9, fontweight='bold')
    plt.ylim(0, max_y * 1.18)
    plt.xticks(indices, dates, rotation=30)
    plt.legend(loc="lower left", bbox_to_anchor=(1, 0), fontsize=9)
    plt.xlabel("Date")
    plt.ylabel("Cost (USD)")
    plt.tight_layout(rect=[0, 0, 0.94, 1])
    plt.savefig(out_path)
    plt.close()

def upload_to_s3(file_path, bucket, prefix="aws_cost"):
    s3_client = boto3.client('s3')
    s3_key = f"{prefix}/aws_cost_{datetime.utcnow().strftime('%Y%m%d_%H%M%S')}.png"
    s3_client.upload_file(file_path, bucket, s3_key, ExtraArgs={'ContentType': 'image/png'})
    public_url = f"https://{bucket}.s3.amazonaws.com/{s3_key}"
    return public_url

def notify_slack(token, channel_id, msg):
    slack_client = WebClient(token=token)
    slack_client.chat_postMessage(channel=channel_id, text=msg)

def lambda_handler(event, context):
    response = get_cost_data(days=7)
    dates, service_costs = parse_cost_data(response)
    dates, service_costs = sort_dates_and_costs(dates, service_costs)

    tmp_file = "/tmp/aws_cost.png"
    create_stacked_bar_chart(dates, service_costs, TOP_N, tmp_file)
    public_url = upload_to_s3(tmp_file, S3_BUCKET)

    monthly_total = get_monthly_total()

    msg = (
        f"▼コスト推移(直近7日分)\n"
        f"{public_url}\n"
        f"\n今月の合計: ${monthly_total:.2f}"
    )
    notify_slack(SLACK_TOKEN, CHANNEL_ID, msg)

    return {
        "status": "done",
        "public_url": public_url,
        "monthly_total": float(monthly_total)
    }
以下環境変数を適宜登録してください。
・SLACK_BOT_TOKEN
Slack App作成時に取得したトークン(xoxb-xxxxxxxx)

・SLACK_CHANNEL_ID
「Slackで対象チャンネル右クリ > コピー > リンクをコピー」でコピーしたURL最後の文字列

・S3_BUCKET
S3のバケット名
続いてレイヤーの設定をします。
以下ライブラリをLambdaで使えるようにする必要があります。
matplotlib(グラフ描画ライブラリ)
numpy(数値計算用ライブラリ)
pillow(画像操作ライブラリ)
requests(Web API呼び出し、データの送受信ライブラリ)
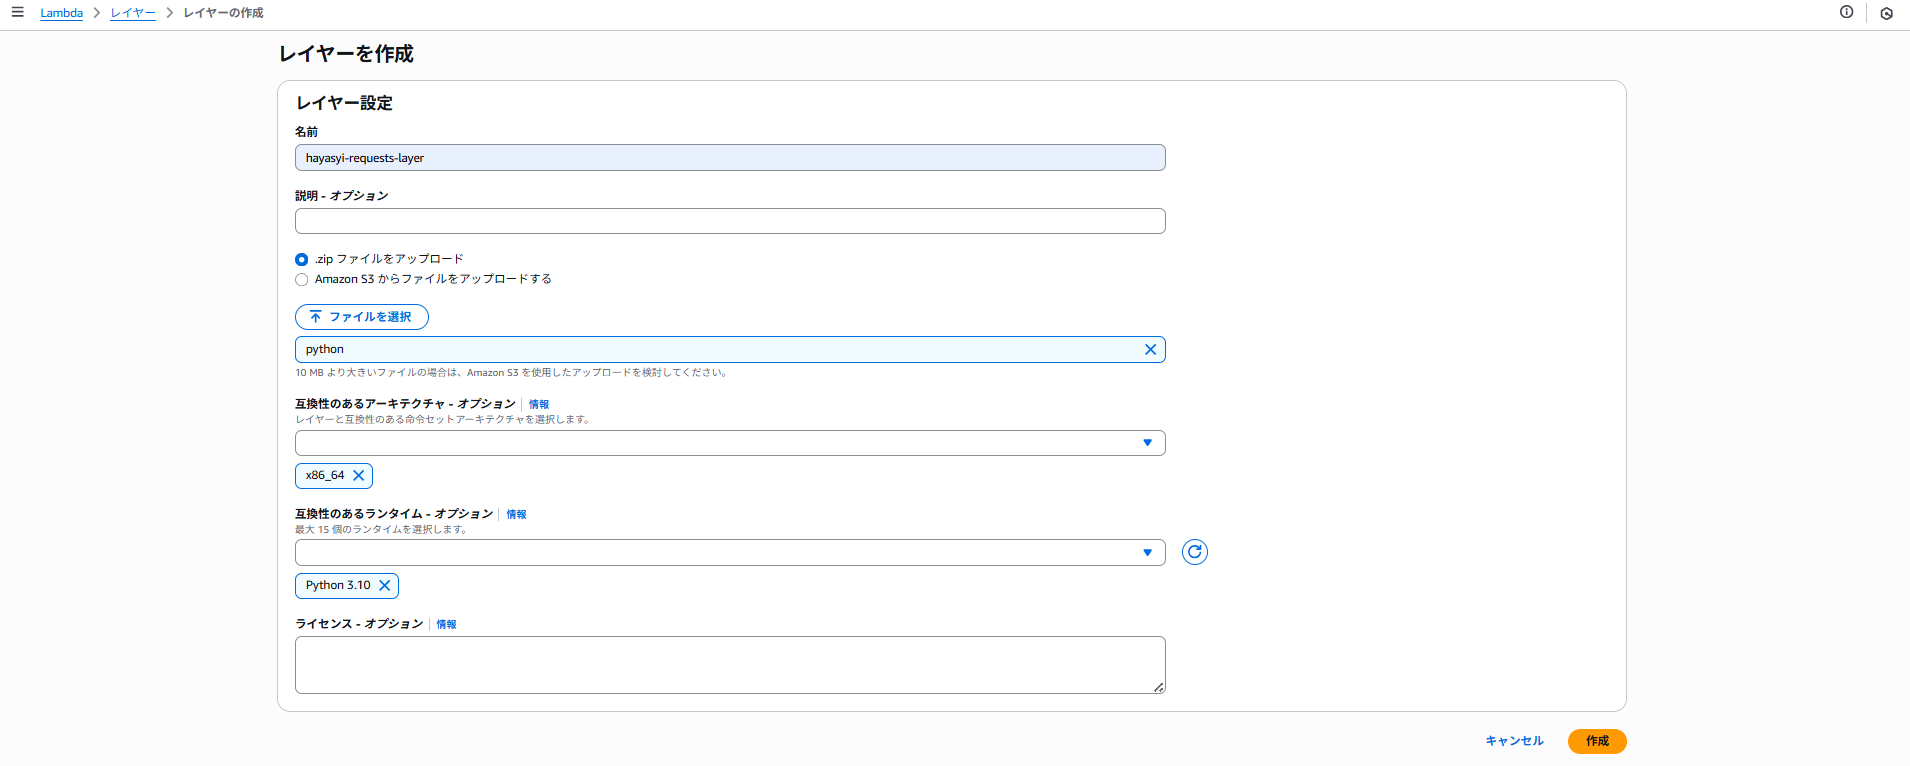
slack_sdk(PythonでのSlackへの通知・投稿ライブラリ)Linux環境で以下を実行してファイルを作成します。
mkdir python
python3 -m pip install slack_sdk matplotlib numpy pillow -t python/
zip -r layer.zip python
作成したファイルを用いてレイヤーを作成します。
「アーキテクチャ」「ランタイム」では作成したLambdaの設定と同じものを選択してください。
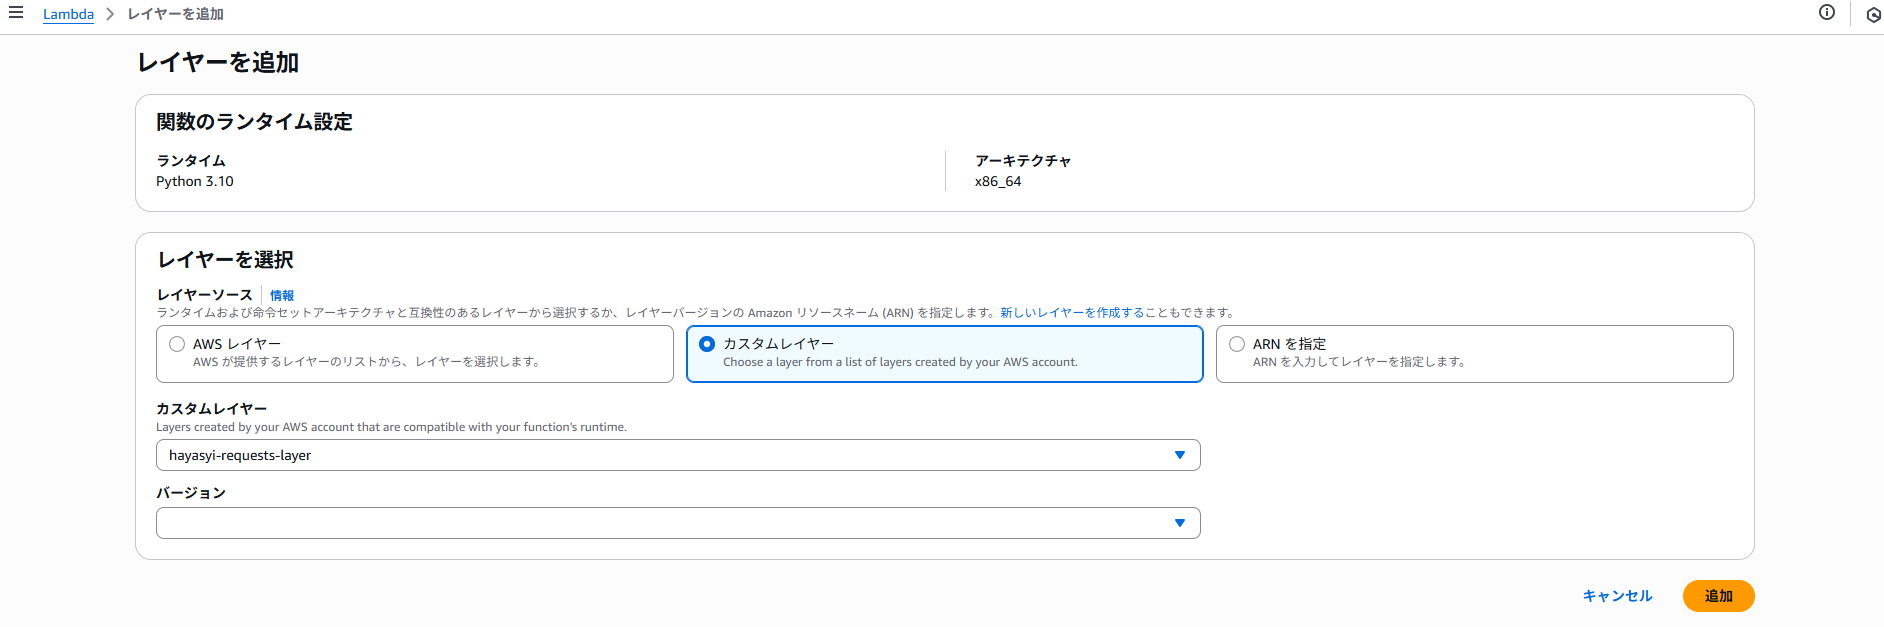
対象の関数に先ほど作成したレイヤーを紐づけます。
あとはEventBridgeで好きな時間に毎日Lambdaが実行されるよう設定してください。
完成
これにて作業は完了です!
こんな感じでSlackにAWSの利用料が通知されるようになりました。
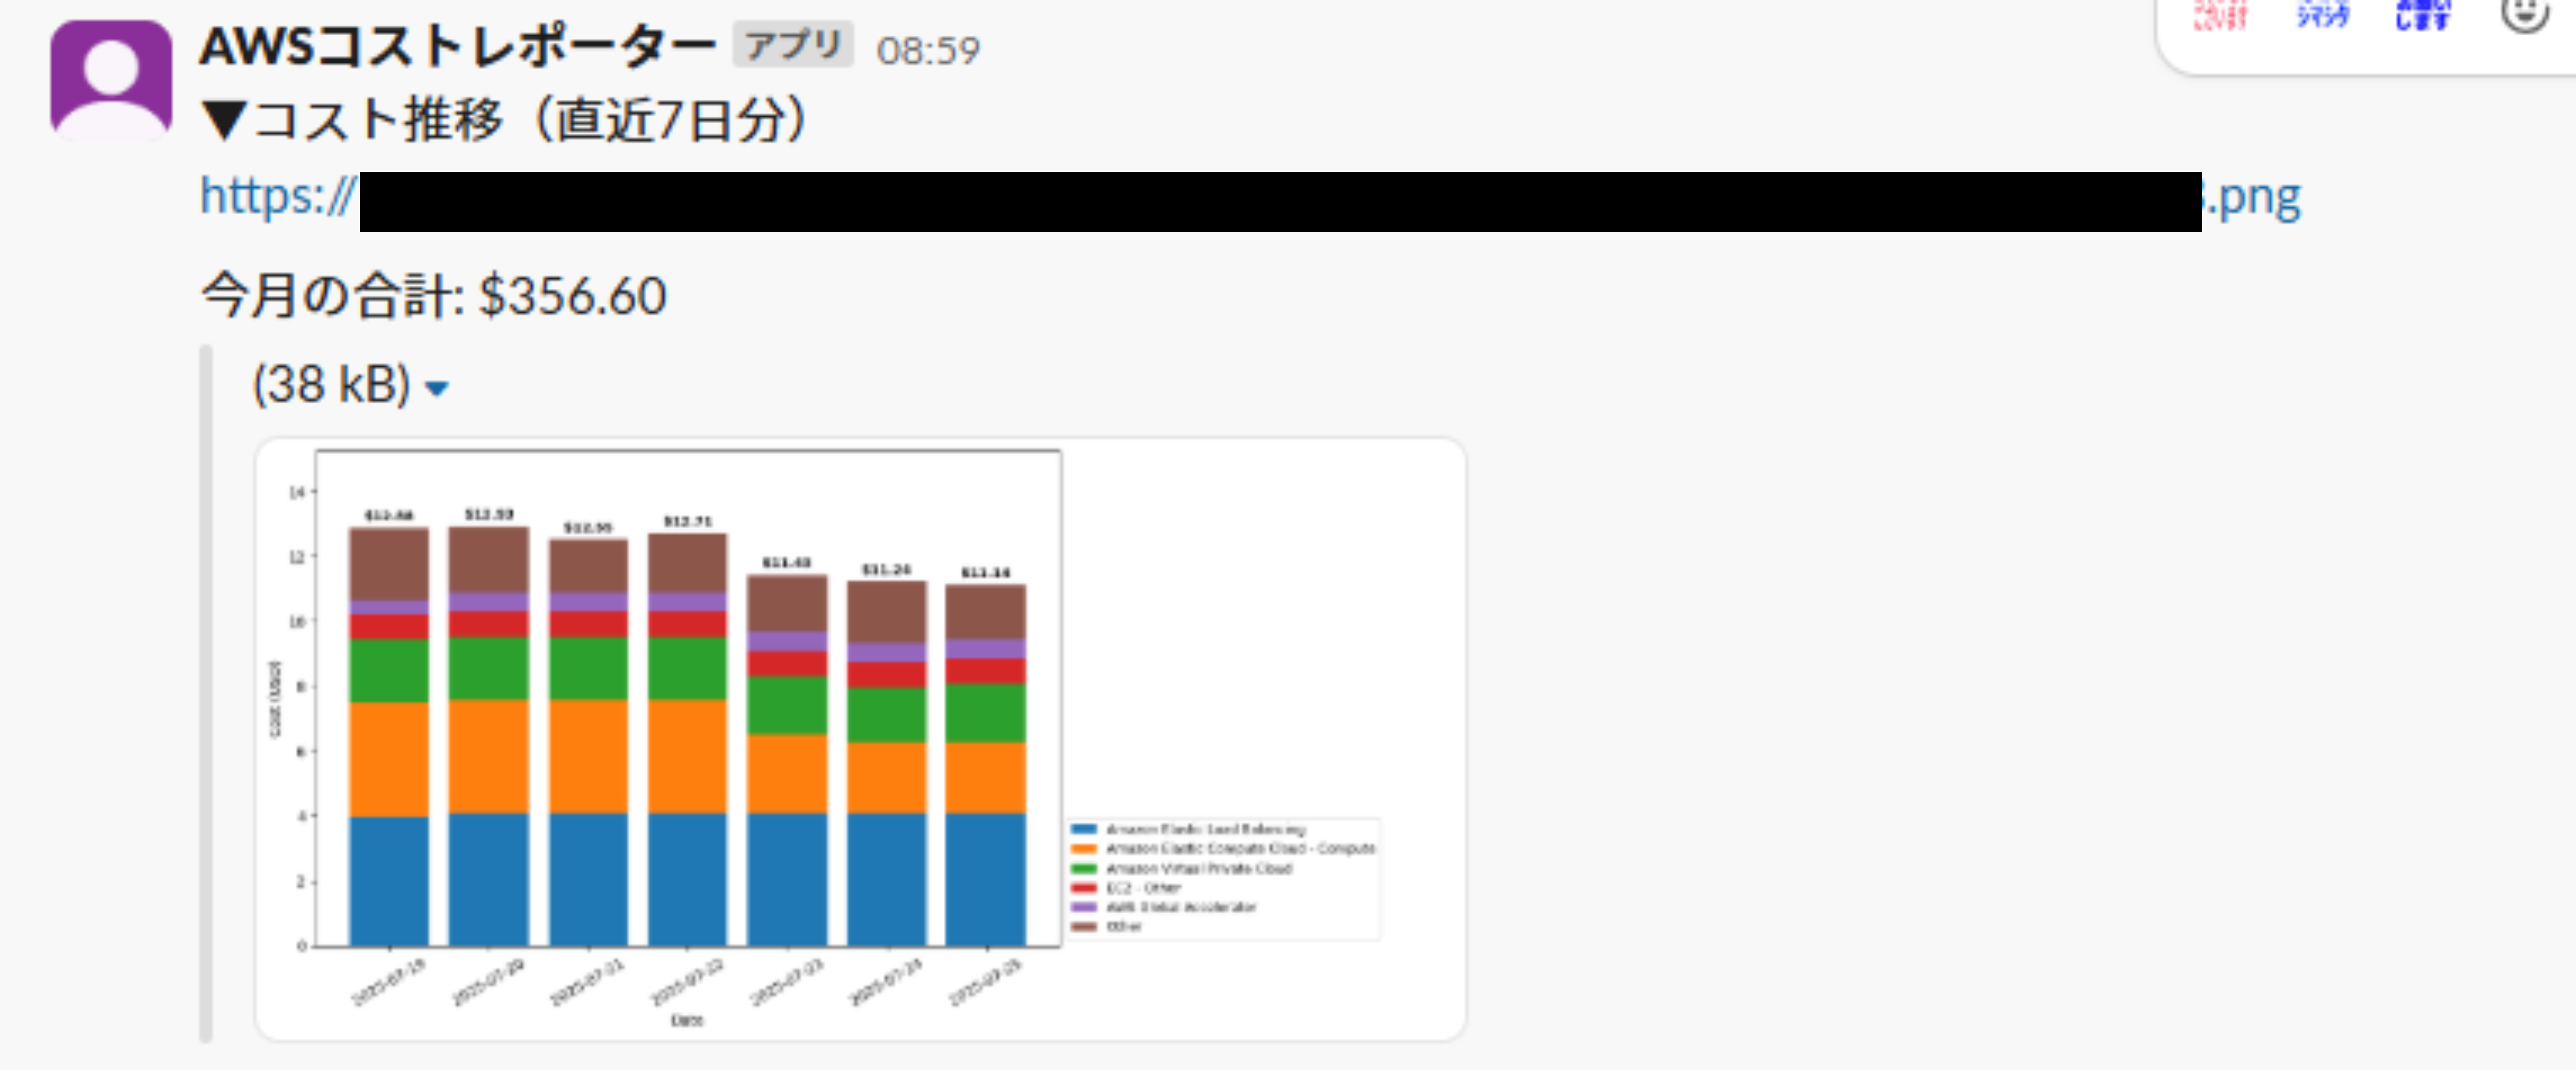
例えば折れ線グラフにしたり、特定のリソースの料金を取得したりすることも可能なので
自分好みにカスタマイズして使ってください。
以上、最後までありがとうございました😺
新米エンジニア